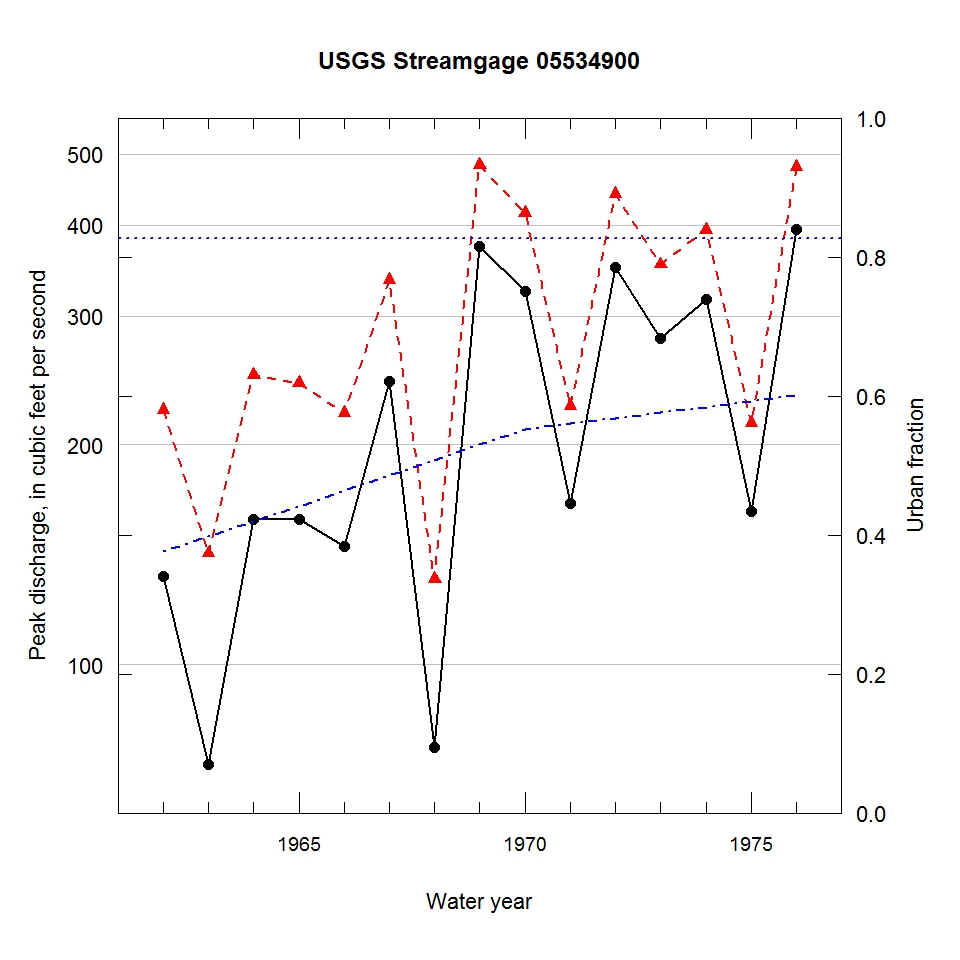
Observed and urbanization-adjusted annual maximum peak discharge and associated urban fraction and precipitation values at USGS streamgage:
05534900 SKOKIE RIVER AT LAKE BLUFF, IL


| Water year | Segment | Discharge code | Cumulative reservoir storage (acre-feet) | Urban fraction | Precipitation (inches) | Observed peak discharge (ft3/s) | Adjusted peak discharge (ft3/s) | Exceedance probability |
| 1962 | 1 | -- | 0 | 0.376 | 0.210 | 132 | 223 | 0.587 |
| 1963 | 1 | -- | 0 | 0.398 | 1.447 | 73 | 142 | 0.896 |
| 1964 | 1 | -- | 0 | 0.420 | 3.073 | 158 | 249 | 0.480 |
| 1965 | 1 | -- | 0 | 0.442 | 1.397 | 158 | 243 | 0.501 |
| 1966 | 1 | -- | 0 | 0.464 | 0.589 | 145 | 221 | 0.593 |
| 1967 | 1 | -- | 0 | 0.486 | 1.476 | 244 | 336 | 0.200 |
| 1968 | 1 | -- | 0 | 0.508 | 1.038 | 77 | 131 | 0.926 |
| 1969 | 1 | -- | 0 | 0.530 | 2.823 | 374 | 483 | 0.058 |
| 1970 | 1 | -- | 0 | 0.552 | 2.295 | 324 | 415 | 0.101 |
| 1971 | 1 | -- | 0 | 0.560 | 0.309 | 166 | 226 | 0.572 |
| 1972 | 1 | -- | 0 | 0.568 | 3.990 | 350 | 441 | 0.081 |
| 1973 | 1 | -- | 0 | 0.576 | 1.596 | 280 | 353 | 0.177 |
| 1974 | 1 | -- | 0 | 0.584 | 1.457 | 316 | 394 | 0.126 |
| 1975 | 1 | -- | 0 | 0.592 | 1.407 | 162 | 214 | 0.623 |
| 1976 | 1 | -- | 0 | 0.600 | 2.225 | 395 | 480 | 0.059 |

